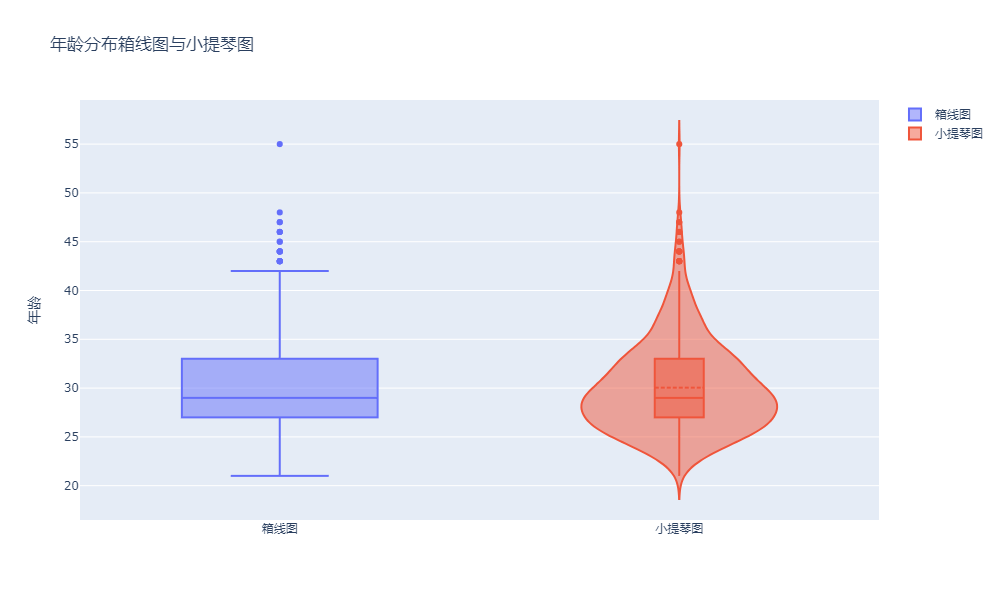
import plotly.express as px

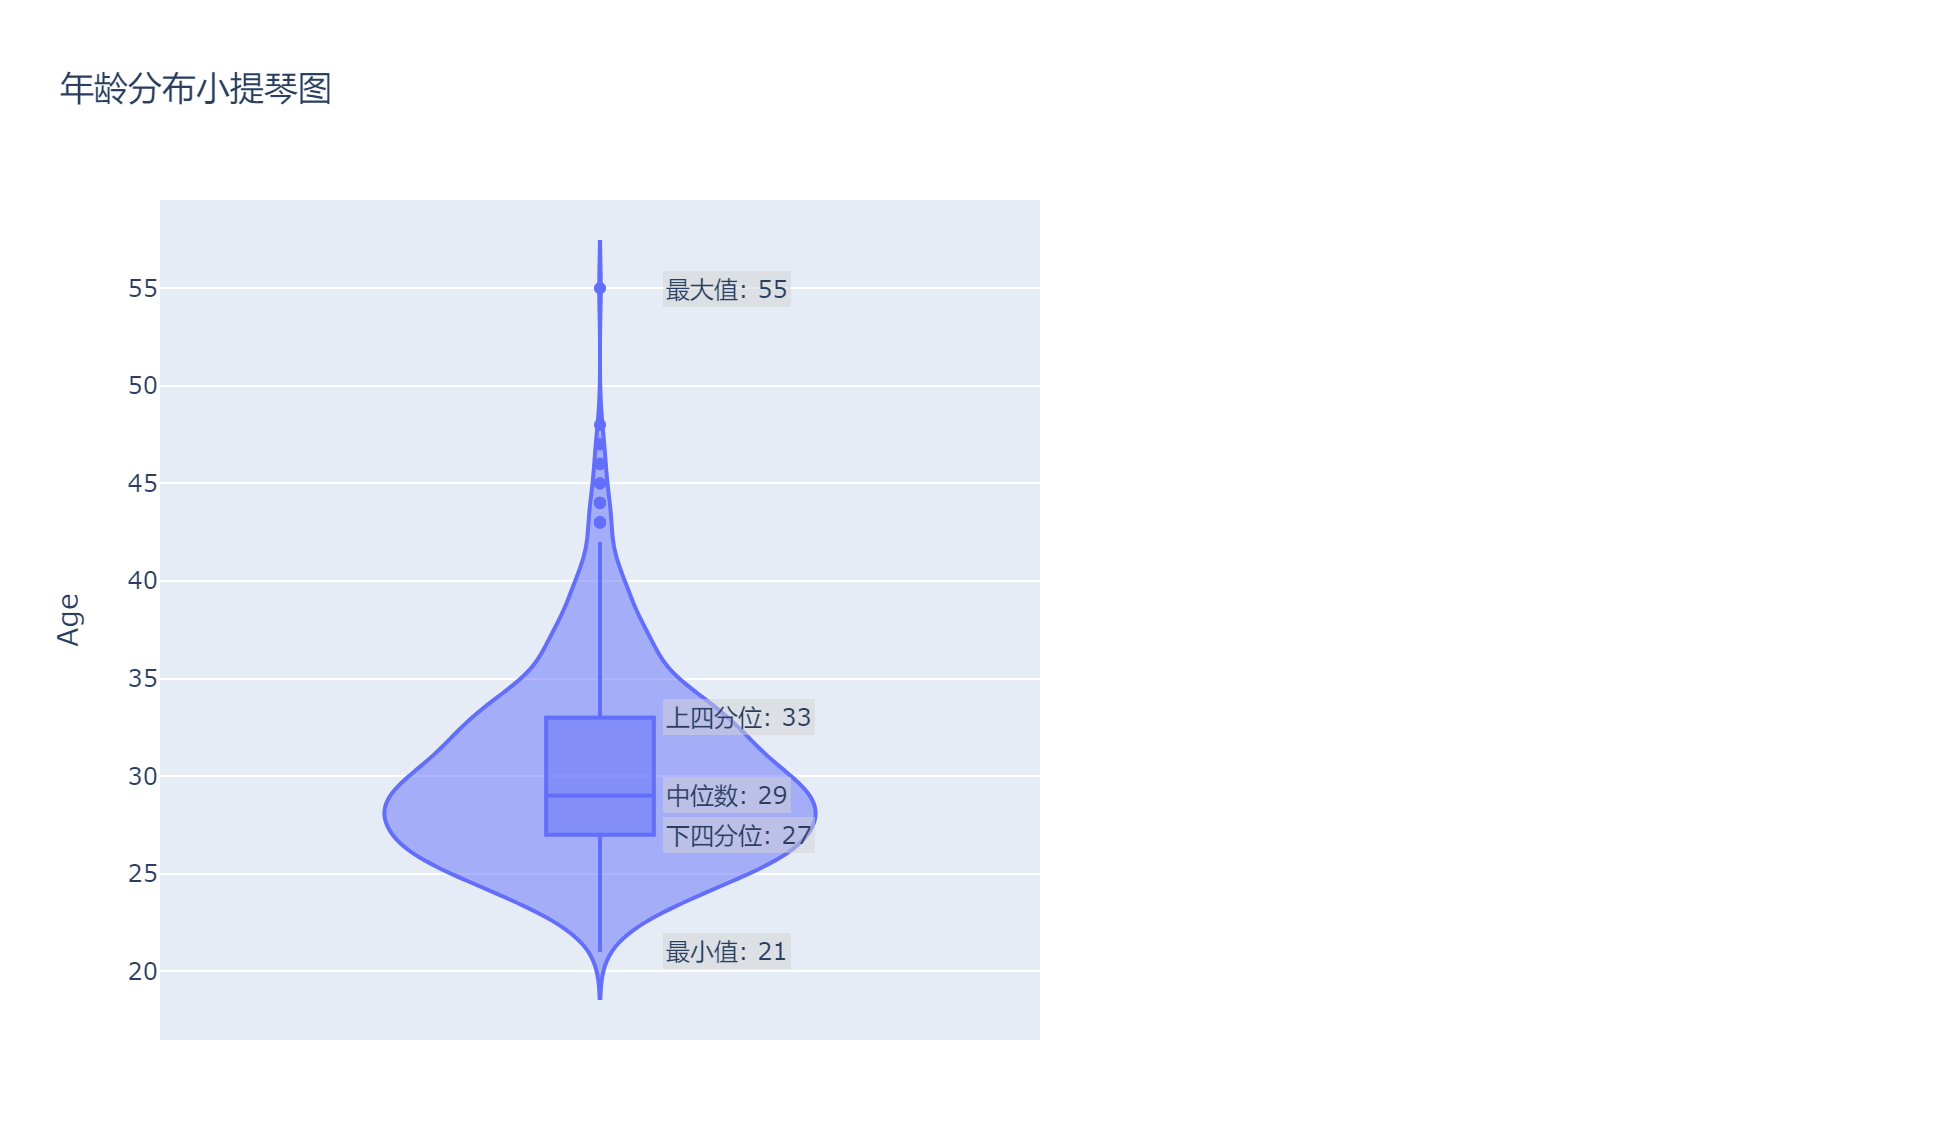
fig = px.violin(employee_dataset, y='Age', width=600, height=600, box=True, points="outliers",
                title='年龄分布小提琴图')


# 计算中位值和四分位数
median = int(employee_dataset['Age'].median())
q1 = int(employee_dataset['Age'].quantile(0.25))
q3 = int(employee_dataset['Age'].quantile(0.75))
max_value = int(employee_dataset['Age'].max())
min_value = int(employee_dataset['Age'].min())

# 添加注解
annotations = [
    dict(x=0.07, y=median, xanchor='left', yanchor='middle', text=f"中位数: {median}", showarrow=False,
         bgcolor='rgba(211,211,211,0.5)', font=dict(size=12)),
    dict(x=0.07, y=q1, xanchor='left', yanchor='middle', text=f"下四分位: {q1}", showarrow=False,
         bgcolor='rgba(211,211,211,0.5)', font=dict(size=12)),
    dict(x=0.07, y=q3, xanchor='left', yanchor='middle', text=f"上四分位: {q3}", showarrow=False,
         bgcolor='rgba(211,211,211,0.5)', font=dict(size=12)),
    dict(x=0.07, y=max_value, xanchor='left', yanchor='middle', text=f"最大值: {max_value}", showarrow=False,
         bgcolor='rgba(211,211,211,0.5)', font=dict(size=12)),
    dict(x=0.07, y=min_value, xanchor='left', yanchor='middle', text=f"最小值: {min_value}", showarrow=False,
         bgcolor='rgba(211,211,211,0.5)', font=dict(size=12))
]

for ann in annotations:
    fig.add_annotation(ann)

# 显示图表
fig.show()

