绘制箱线图和小提琴图描述数据分布

NOTE

在数据分析中,我们经常依赖聚合指标来描述和观测某类特征的状态,比如平均年龄、员工在当前岗位的平均任职时长、在当前职级的平均停留时长等等。

但平均值有时存在局限,可能难以发现规律,尤其在小样本情况下,甚至可能因为部分极值的影响而产生错误的结论。

此时可以尝试绘制箱线图(Box Plot)和小提琴图(Violin Plot)来查看一下数据的分布特征,或许可以从异常值以及数据分布的偏态等方面得到一些更深刻的洞察。

本文将介绍如何使用 Plotly 库在 Python 中绘制这两种图表。

构造数据集

假设需要分析某企业员工的年龄分布。首先,我们构造一个模拟的员工年龄数据集。这里使用 Gamma 分布来模拟真实的年龄分布情况,并确保所有模拟的年龄都超过 20 岁。

import numpy as np
import pandas as pd

# 使用Gamma分布模拟企业中员工年龄的分布
np.random.seed(1994)
age = np.random.gamma(shape=5, scale=2, size=1000) + 20 # 使年龄最小在20以上

# 年龄取整
age_rounded = np.round(age).astype(int)

# 构建数据集
employee_dataset = pd.DataFrame({
    "Employee ID": [f"E{str(i).zfill(4)}" for i in range(1, 1001)],
    "Age": age_rounded
})

绘制箱线图和小提琴图

单独绘制箱线图和小提琴图的方法,可以参考官网的demo示例,我们直接演示两个在实践中可能用到的进阶技巧。

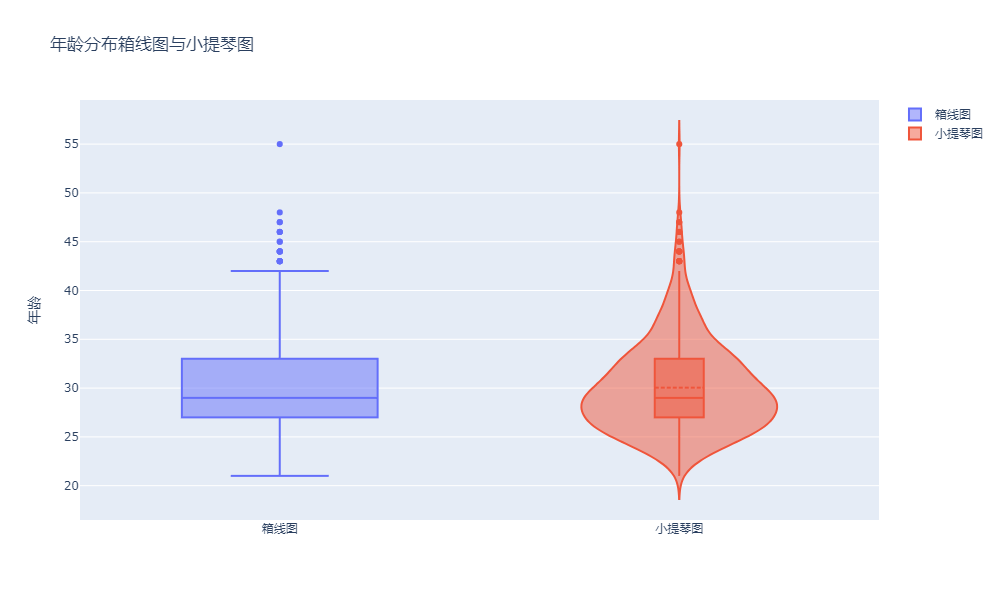
在同一张图上绘制箱线图和小提琴图

将箱线图和小提琴图放在同一张图上可以直观地比较数据分布的形状和范围

import plotly.graph_objects as go

# 创建箱线图
box = go.Box(y=employee_dataset['Age'], name='箱线图', boxpoints='outliers')

# 创建小提琴图
violin = go.Violin(y=employee_dataset['Age'], name='小提琴图', box_visible=True, meanline_visible=True, points='outliers')

# 将图表数据组合在一起
data = [box, violin]

# 定义图表布局
layout = go.Layout(title='年龄分布箱线图与小提琴图', yaxis_title='年龄', width=600, height=600)

# 创建图表
fig = go.Figure(data=data, layout=layout)

fig.update_layout(width=800, height=600)

# 显示图表
fig.show()

效果展示

Aplotly_violin_box

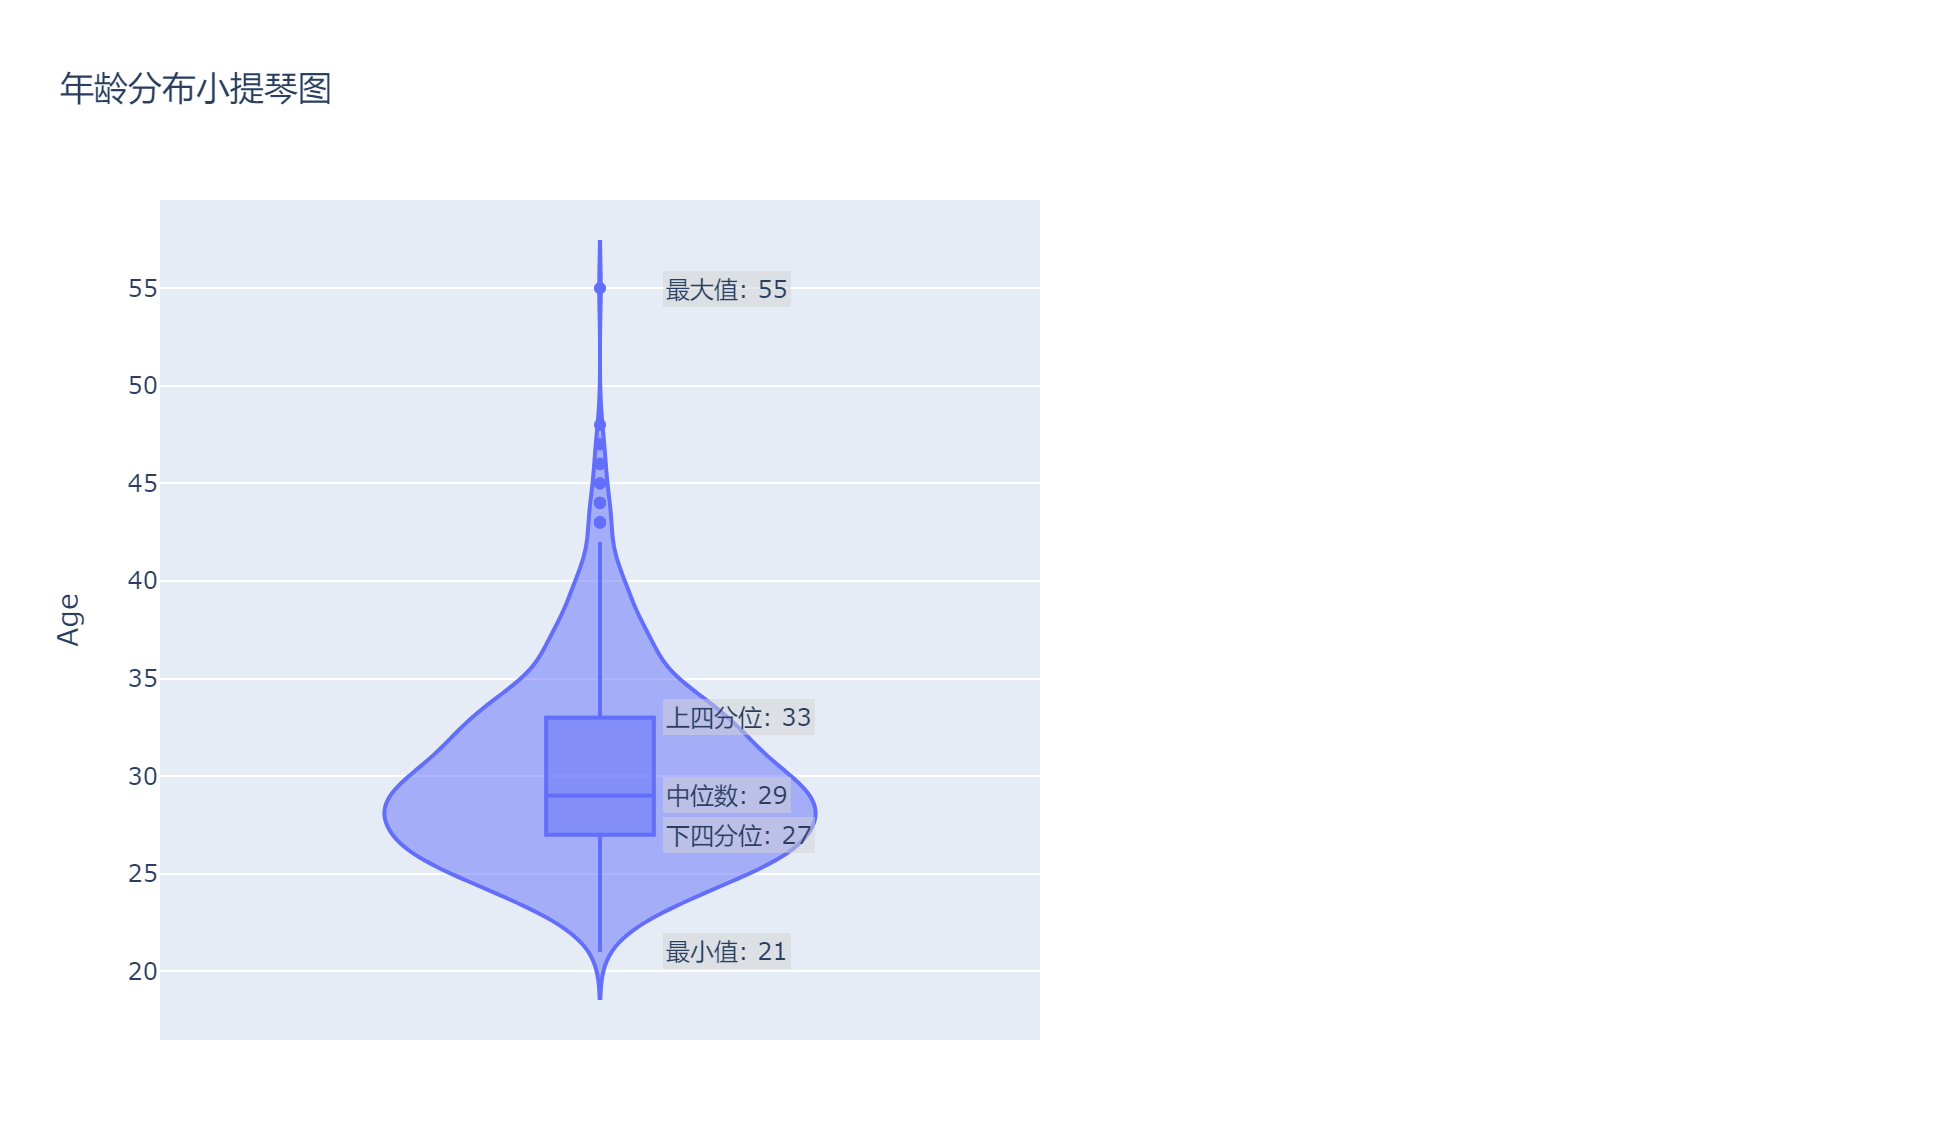
在图中增加自定义注释

由于Plotly是一个交互式的图表库,默认只有将鼠标悬停在图表上才能看到关键数据。但有时我们需要截图或者导出图表,这时就需要手动在图表中添加一些注释,比如中位数、四分位数、最大值、最小值等。

import plotly.express as px

fig = px.violin(employee_dataset, y='Age', width=600, height=600, box=True, points="outliers",
                title='年龄分布小提琴图')


# 计算中位值和四分位数
median = int(employee_dataset['Age'].median())
q1 = int(employee_dataset['Age'].quantile(0.25))
q3 = int(employee_dataset['Age'].quantile(0.75))
max_value = int(employee_dataset['Age'].max())
min_value = int(employee_dataset['Age'].min())

# 添加注解
annotations = [
    dict(x=0.07, y=median, xanchor='left', yanchor='middle', text=f"中位数: {median}", showarrow=False,
         bgcolor='rgba(211,211,211,0.5)', font=dict(size=12)),
    dict(x=0.07, y=q1, xanchor='left', yanchor='middle', text=f"下四分位: {q1}", showarrow=False,
         bgcolor='rgba(211,211,211,0.5)', font=dict(size=12)),
    dict(x=0.07, y=q3, xanchor='left', yanchor='middle', text=f"上四分位: {q3}", showarrow=False,
         bgcolor='rgba(211,211,211,0.5)', font=dict(size=12)),
    dict(x=0.07, y=max_value, xanchor='left', yanchor='middle', text=f"最大值: {max_value}", showarrow=False,
         bgcolor='rgba(211,211,211,0.5)', font=dict(size=12)),
    dict(x=0.07, y=min_value, xanchor='left', yanchor='middle', text=f"最小值: {min_value}", showarrow=False,
         bgcolor='rgba(211,211,211,0.5)', font=dict(size=12))
]

for ann in annotations:
    fig.add_annotation(ann)

# 显示图表
fig.show()
效果展示

plotly_with_annotations