建模目标与数据质量
了解建模目标
在当今的企业环境中,员工流失是一个普遍存在的问题,它会对公司的运营效率和成本产生重大影响。通过对员工的各种属性和工作行为的数字化描述,我们可以在这些数据中寻找导致员工流失的潜在因素。更进一步,如果能够实时接入这些数据,我们或许能够借助模型来预测未来员工流失的风险,从而及时制定相应的挽留策略,防止员工真实流失情况的发生。
因此,在这个背景下,我们的算法建模目标主要有两个:
- 一是预测员工是否会流失
- 二是找出影响员工流失的关键因素,以辅助人力资源部门进行策略调整或制定员工挽留措施。
综合上述两个目标,我们可以发现,我们需要的模型不仅要具备较强的预测能力,还需要能够输出特征重要性排名,并且最好具备一定的可解释性,即能够清晰地解释特征变化是如何影响标签取值变化的。
字段解释
| 字段名称 | 含义 |
|---|
| Age | 年龄 |
| Attrition | 离职情况(是否离职) |
| BusinessTravel | 出差频率 |
| DailyRate | 每日工资 |
| Department | 部门 |
| DistanceFromHome | 离家距离 |
| Education | 教育水平 |
| EducationField | 教育领域 |
| EmployeeCount | 员工计数 |
| id | 员工编号 |
| EnvironmentSatisfaction | 环境满意度 |
| Gender | 性别 |
| HourlyRate | 时薪 |
| JobInvolvement | 工作投入度 |
| JobLevel | 工作级别 |
| JobRole | 职位 |
| JobSatisfaction | 工作满意度 |
| MaritalStatus | 婚姻状况 |
| MonthlyIncome | 月收入 |
| MonthlyRate | 月工资 |
| NumCompaniesWorked | 曾工作过的公司数量 |
| Over18 | 是否成年 |
| OverTime | 加班情况 |
| PercentSalaryHike | 加薪百分比 |
| PerformanceRating | 绩效评级 |
| RelationshipSatisfaction | 人际关系满意度 |
| StandardHours | 标准工时 |
| StockOptionLevel | 股票期权级别 |
| TotalWorkingYears | 总工作年限 |
| TrainingTimesLastYear | 去年培训次数 |
| WorkLifeBalance | 工作与生活的平衡 |
| YearsAtCompany | 在公司的年限 |
| YearsInCurrentRole | 当前职位的年限 |
| YearsSinceLastPromotion | 自上次晋升后的年限 |
| YearsWithCurrManager | 与现任经理共事的年限 |
数据质量分析
一旦我们掌握了数据集的字段含义,接下来的关键步骤就是对数据质量进行分析,这是数据探索过程中最基础也是最重要的角度。
数据质量分析的常见任务包括缺失值检查、异常值检测、重复值检查、数据类型检查等。
数据结构查看
print(f"训练集数据结构: {train_df.shape}")
print(f"测试集数据结构: {test_df.shape}")
Output
训练集数据结构: (1677, 35)
测试集数据结构: (1119, 34)
数据质量检查
NOTE
这里常用的代码为了方便复用,都封装成了函数。如果只是简单查看,可以直接复制函数内的核心代码执行。
1. 缺失值、唯一值和数据类型
这里我们定义一个任务函数 column_info,用于一次性输出每个字段的缺失值、唯一值和数据类型。
import pandas as pd
from tabulate import tabulate

def column_info(df, sort_by='default'):
    """
    计算并输出每一列的缺失值、唯一值和数据类型。

    参数:
    df: 数据集(DataFrame)
    sort_by: 排序依据,接受的值包括 'missing', 'unique' 或 'default'(默认顺序)
    """
    # 创建列信息表,直接计算缺失值和唯一值
    column_info_df = pd.DataFrame({
        'Missing_Count': df.isnull().sum(),
        'Missing_Percent': df.isnull().mean() * 100,  # 使用mean()直接得到百分比
        'Unique_Count': df.nunique(),
        'Data_Type': df.dtypes
    })

    # 根据指定的排序依据进行排序
    if sort_by == 'missing':
        column_info_df.sort_values(by='Missing_Count', ascending=False, inplace=True)
    elif sort_by == 'unique':
        column_info_df.sort_values(by='Unique_Count', ascending=False, inplace=True)

    # 输出列信息表格
    print("Column Information:")
    print(tabulate(column_info_df, headers='keys', tablefmt='pretty'))

# 查看训练集数据质量
column_info(train_df, sort_by='unique')
Output
Column Information:
+--------------------------+---------------+-----------------+--------------+-----------+
|                          | Missing_Count | Missing_Percent | Unique_Count | Data_Type |
+--------------------------+---------------+-----------------+--------------+-----------+
|            id            |       0       |       0.0       |     1677     |   int64   |
|       MonthlyRate        |       0       |       0.0       |     903      |   int64   |
|      MonthlyIncome       |       0       |       0.0       |     895      |   int64   |
|        DailyRate         |       0       |       0.0       |     625      |   int64   |
|        HourlyRate        |       0       |       0.0       |      71      |   int64   |
|           Age            |       0       |       0.0       |      43      |   int64   |
|    TotalWorkingYears     |       0       |       0.0       |      41      |   int64   |
|      YearsAtCompany      |       0       |       0.0       |      34      |   int64   |
|     DistanceFromHome     |       0       |       0.0       |      29      |   int64   |
|    YearsInCurrentRole    |       0       |       0.0       |      19      |   int64   |
|   YearsWithCurrManager   |       0       |       0.0       |      18      |   int64   |
| YearsSinceLastPromotion  |       0       |       0.0       |      16      |   int64   |
|    PercentSalaryHike     |       0       |       0.0       |      15      |   int64   |
|    NumCompaniesWorked    |       0       |       0.0       |      10      |   int64   |
|         JobRole          |       0       |       0.0       |      9       |  object   |
|  TrainingTimesLastYear   |       0       |       0.0       |      7       |   int64   |
|        Education         |       0       |       0.0       |      6       |   int64   |
|         JobLevel         |       0       |       0.0       |      6       |   int64   |
|      EducationField      |       0       |       0.0       |      6       |  object   |
|     JobSatisfaction      |       0       |       0.0       |      4       |   int64   |
| EnvironmentSatisfaction  |       0       |       0.0       |      4       |   int64   |
|     WorkLifeBalance      |       0       |       0.0       |      4       |   int64   |
|     StockOptionLevel     |       0       |       0.0       |      4       |   int64   |
| RelationshipSatisfaction |       0       |       0.0       |      4       |   int64   |
|      JobInvolvement      |       0       |       0.0       |      4       |   int64   |
|        Department        |       0       |       0.0       |      3       |  object   |
|      BusinessTravel      |       0       |       0.0       |      3       |  object   |
|      MaritalStatus       |       0       |       0.0       |      3       |  object   |
|    PerformanceRating     |       0       |       0.0       |      2       |   int64   |
|          Gender          |       0       |       0.0       |      2       |  object   |
|         OverTime         |       0       |       0.0       |      2       |  object   |
|        Attrition         |       0       |       0.0       |      2       |   int64   |
|      StandardHours       |       0       |       0.0       |      1       |   int64   |
|          Over18          |       0       |       0.0       |      1       |  object   |
|      EmployeeCount       |       0       |       0.0       |      1       |   int64   |
+--------------------------+---------------+-----------------+--------------+-----------+
从上面的输出结果可以看出训练集中没有缺失值。
但我们发现 StandardHours、Over18 和 EmployeeCount 这三列的唯一值只有一个,这意味着这三列的值都是相同的,对于模型训练没有任何意义,在建模中可以直接删除。
另外,id 列的唯一值数量为 1677,这意味着每一行的 id 都是唯一的,对于模型训练也没有任何意义,可以删除。
2. 检查重复数据
接下来我们看一下数据集中有没有重复数据,在企业的真实环境中,由于收集的数据不干净导致数据存在重复行是很常见的。
def duplicate_info(df):
    """
    计算并输出数据集的重复值统计。

    参数:
    df: 数据集(DataFrame)
    """
    total_count = len(df)

    # 计算数据集的重复值及占比
    duplicate_count = df.duplicated().sum()
    duplicate_percent = (duplicate_count / total_count) * 100
    duplicate_info_df = pd.DataFrame({
        'Duplicate_Count': [duplicate_count],
        'Duplicate_Percent': [duplicate_percent]
    })

    # 输出重复值统计
    print("Duplicate Rows Information:")
    print(tabulate(duplicate_info_df, headers='keys', tablefmt='psql'))

# 检验训练集中是否存在重复数据
duplicate_info(train_df)
Output
Duplicate Rows Information:
+----+-------------------+---------------------+
|    |   Duplicate_Count |   Duplicate_Percent |
|----+-------------------+---------------------|
|  0 |                 0 |                   0 |
+----+-------------------+---------------------+
3. 测试集的未知数据
在检查完数据集中不存在数据缺失和重复数据后,还不能直接认定为这是一个完美的数据集。
在实际业务场景中,测试集(或新产生的数据)中可能会出现训练集中没有出现过的数据,这些数据被称为未知数据。
当然这一检验仅针对离散字段而言。
def check_categorical_values(train_df, test_df, categorical_cols):
    """
    检查测试数据集中指定的离散字段取值是否都包含在训练数据集中。

    参数:
    categorical_cols (list): 要检查的离散字段列表
    """
    issues = {}
    for col in categorical_cols:
        train_values = set(train_df[col].unique())
        test_values = set(test_df[col].unique())
        if not test_values.issubset(train_values):
            issues[col] = test_values - train_values

    if issues:
        print("以下离散字段在测试集中包含训练集中未出现的取值:")
        for col, values in issues.items():
            print(f"{col}: {values}")
    else:
        print("测试集中所有离散字段的取值都包含在训练集中。")

check_categorical_values(train_df, test_df, categorical_cols)
Output
以下离散字段在测试集中包含训练集中未出现的取值:
EnvironmentSatisfaction: {0}
JobInvolvement: {0}
StockOptionLevel: {4}
从结果可以看出,测试集中的 EnvironmentSatisfaction、JobInvolvement 和 StockOptionLevel 这三个字段包含了训练集中未出现的取值。
TIP
一般来说,在处理测试集中包含训练集中未出现的取值时,针对 One-Hot 编码,一般采用忽略未知取值的策略,而对于 Ordinal Encoding,一般会讲未知取值映射到一个默认值,比如 -1。
4. 异常值
最后,我们还需要检查数据集中是否存在异常值,一般都是针对连续型字段。
异常值检测有很多方法,可以通过三倍标准差、箱线图、以及分布图等方式来检测。相较而言,箱线图与分布图更加直观,方便我们结合业务理解判断是否为异常值。
我的习惯是先用三倍标准差检测异常值,再结合箱线图和分布图来进一步确认。
-
异常值检测(三倍标准差)
这里定义了一个函数来计算每个字段是否存在异常值,注意我设置了两个输出,一个是异常值数量,用于打印查看,另一个是异常值字段的名称列表,方便我们后续绘图处理。
def find_outliers(df, cols=None):
    """
    利用三倍标准差法来识别数据集中每列的异常值。如果没有传入列列表,则自动检测所有数值型字段。

    参数:
    df (pd.DataFrame): 要分析的数据集。
    cols (list, optional): 要分析的字段列表。如果没有提供,则自动检测所有数值型列。

    返回:
    tuple: 包含两个元素的元组:
        - outlier_counts (dict): 每个列的异常值数量。
        - outlier_columns (list): 存在异常值的字段名称列表。
    """
    if cols is None:
        cols = df.select_dtypes(include=['int64', 'float64']).columns

    outlier_counts = {}
    outlier_columns = []
    for col in cols:
        mean = df[col].mean()
        std = df[col].std()
        lower_bound = mean - 3 * std
        upper_bound = mean + 3 * std
        outliers = df[(df[col] < lower_bound) | (df[col] > upper_bound)]
        outlier_count = outliers.shape[0]
        if outlier_count > 0:
            outlier_columns.append(col)
        outlier_counts[col] = outlier_count
    return outlier_counts, outlier_columns

# 检查异常值
outlier_counts, outlier_columns = find_outliers(train_df)

# 打印每个字段的异常值数量
for col, count in outlier_counts.items():
    if count > 0:
        print(f"字段: {col} - 异常值数量: {count}")
Output
字段: DailyRate - 异常值数量: 1
字段: Education - 异常值数量: 1
字段: JobLevel - 异常值数量: 1
字段: MonthlyIncome - 异常值数量: 9
字段: TotalWorkingYears - 异常值数量: 21
字段: YearsAtCompany - 异常值数量: 26
字段: YearsInCurrentRole - 异常值数量: 21
字段: YearsSinceLastPromotion - 异常值数量: 34
字段: YearsWithCurrManager - 异常值数量: 16
当然,这里检测出来的异常值,并不意味着在实际业务场景中也是异常,接下来结合箱线图和分布图来进一步确认。
-
箱线图与分布图
这里同样定义一个绘图函数,将上一步中检测出的异常值字段的箱线图和分布图绘制出来。
def visualize_outliers(df, cols):
    """
    使用箱线图和直方图可视化数据集中可能存在异常值的字段。

    参数:
    df (pd.DataFrame): 要分析的数据集。
    cols (list): 要可视化的列的列表。
    """
    for col in cols:
        plt.rcParams['axes.facecolor'] = '#F4F2F0'
        plt.rcParams['figure.facecolor'] = '#F4F2F0'
        plt.rcParams['axes.grid'] = False

        fig, axes = plt.subplots(1, 2, figsize=(8, 4))

        # 绘制箱线图
        sns.boxplot(y=df[col], color='#91ABB4', ax=axes[0])
        axes[0].set_title(f'Boxplot of {col}')

        # 绘制直方图
        sns.histplot(df[col], bins=30, kde=True, color='#214D5C', ax=axes[1])
        axes[1].set_title(f'Histogram of {col}')

        plt.tight_layout()
        plt.show()

# 可视化存在异常值的列
visualize_outliers(train_df, outlier_columns)
-
图表查看
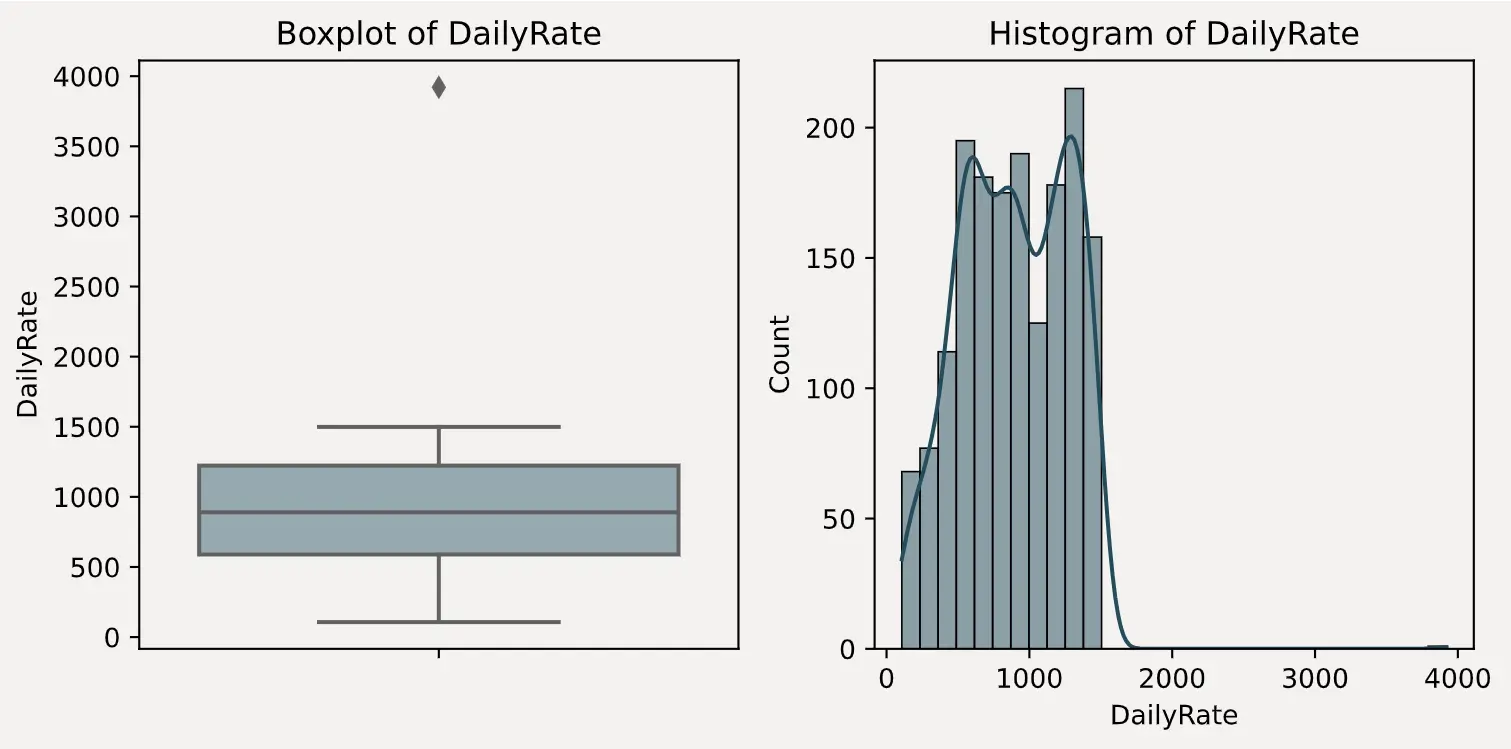
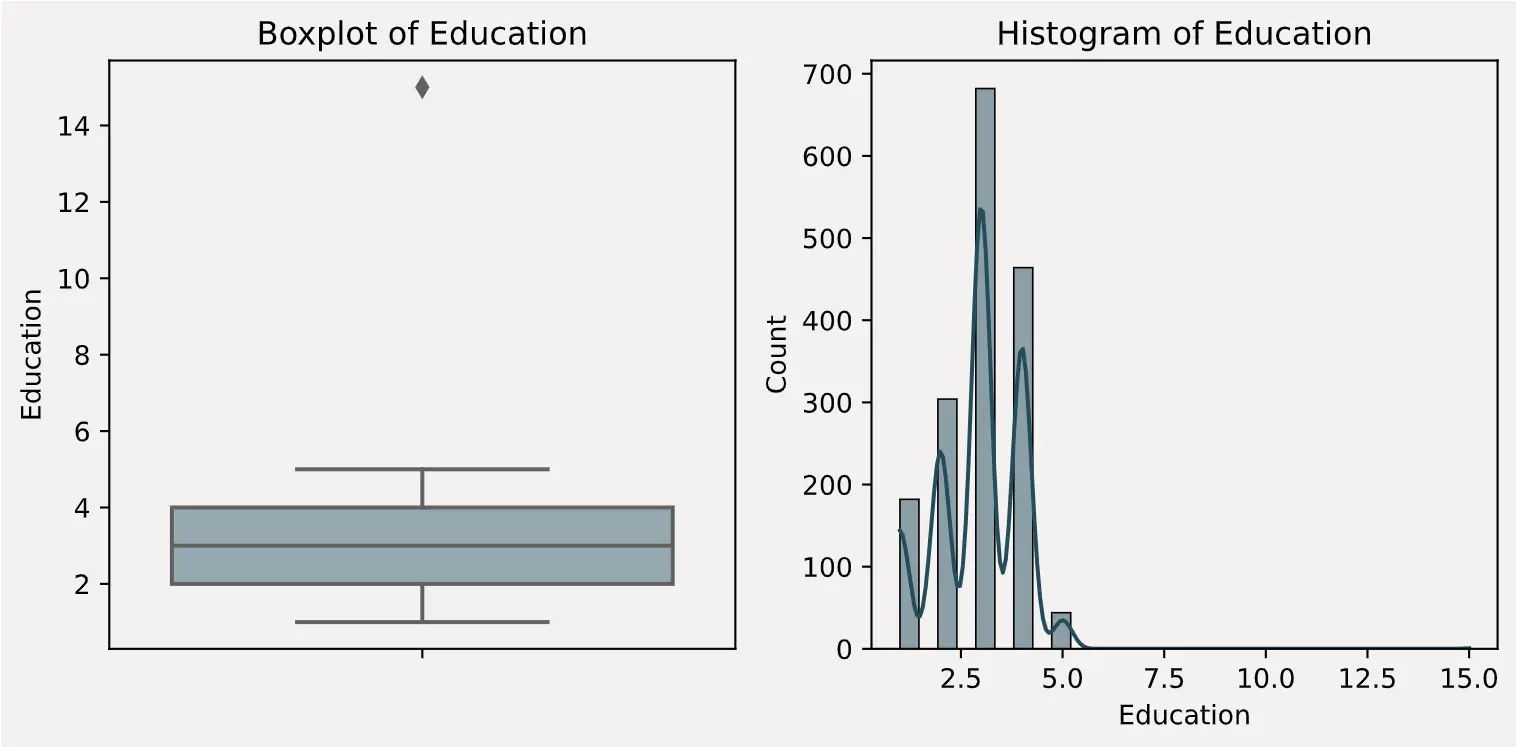
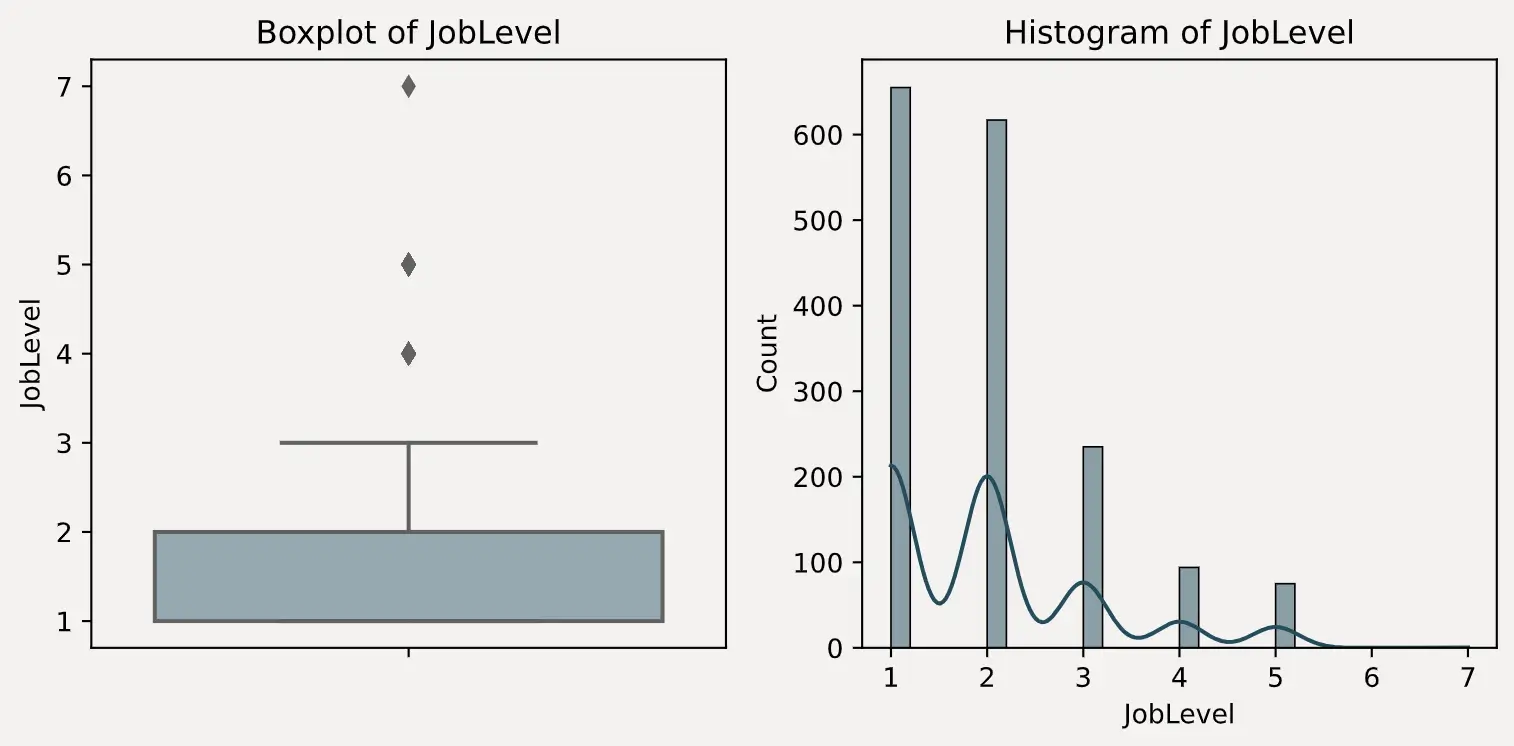
结合前面的异常值统计,以及绘制出来的箱线图和直方图分布,可以很明显的判断出 DailyRate、Education 和 JobLevel 这三个字段存在异常值。
DailyRate 有且只有一个值接近 4000Education 有且只有一个值为 15JobLevel 有且只有一个值为 7
TIP
通常来说,对于训练集,一般会选择将异常值替换为众数或截断为边界值。如果放任异常值不管,可能会对模型的训练产生负面影响,影响模型的性能和稳定性。


